
EURUSD CHART...FOREX PROS
 I'am going to share with you some charts from August 10, 2012. 1 1/2 hours of trading produced 15% profit. Could have been more but I want to stick to my rules...When you don't stick to your rules you loose money. The charts below show Central Standard Time for the Americas. All trades are selling the Euro against the American Dollar.
Click on the charts to see the whole chart...


I'am going to share with you some charts from August 10, 2012. 1 1/2 hours of trading produced 15% profit. Could have been more but I want to stick to my rules...When you don't stick to your rules you loose money. The charts below show Central Standard Time for the Americas. All trades are selling the Euro against the American Dollar.Click on the charts to see the whole chart...

I made a trade the night before selling the Euro against the American Dollar. I actually made 3 small trades and went to bed when the final trade was made.

I made another trade

I made another trade.

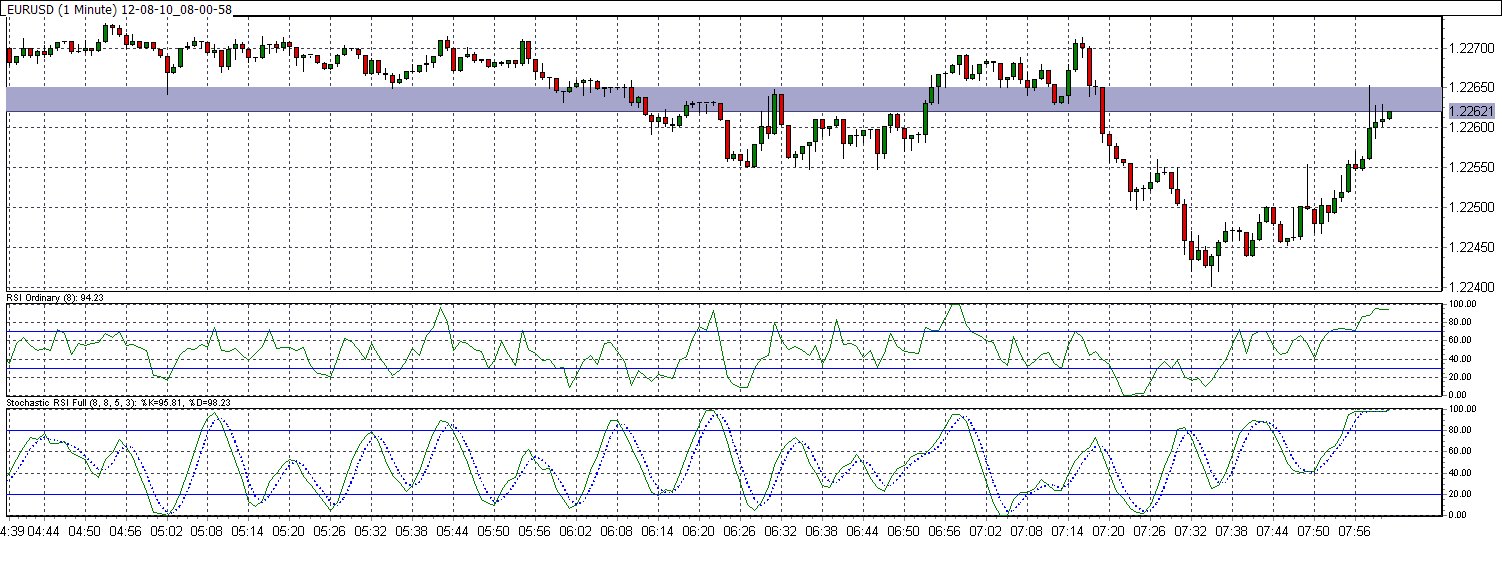
I went to the 1 minute chart to get another perspective, notice the diversion between the RSI and the price.
Trade the EURUSD chart like the FOREX pros.

I drew a channel down and saw the diversion between the price and the RSI as well as the candlestick hammer indicating a bottom for the 1 minute chart. Based on the information I had in the chart...I liquidated all of my positions and called it a day.
The chart chart above shows you what happened after I liquidated

The chart chart above shows you what happened after I liquidated

The chart chart above shows you what happened after I liquidated
EURUSD CHART...FOREX PROS
No comments:
Post a Comment